100% FREE ONLINE DATING
| Topic: NASA report on Climate Change | |
|---|---|

|
|
|
Yeah, those hippies at NASA sure have an agenda...
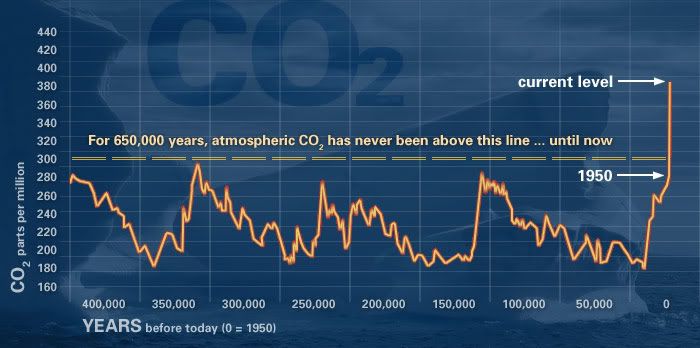
"The Earth's climate has changed throughout history. Just in the last 650,000 years there have been seven cycles of glacial advance and retreat, with the abrupt end of the last ice age about seven thousand years ago, marking the beginning of the modern climate era —and of human civilization. Most of these changes are attributed to the very small changes in the Earth’s orbit changing the amount of solar energy the Earth receives. The current warming trend is of particular significance because most of it is very likely human-induced and proceeding at a rate that is unprecedented in the past 1,300 years. Earth-orbiting satellites and other technological advances have enabled scientists to see the big picture, collecting many different types of information about our planet and its climate on a global scale. Studying these climate data collected over many years reveal the signals of a changing climate. Certain facts about Earths climate are not in dispute: The heat-trapping nature of carbon dioxide and other gases was demonstrated in the mid-19th century.2 Their ability to affect the transfer of infrared energy through the atmosphere is the scientific basis of many JPL-designed instruments, such as AIRS. Increased levels of greenhouse gases must cause the Earth to warm in response. Ice cores drawn from Greenland, Antarctica, and tropical mountain glaciers show that the Earth’s climate responds to changes in solar output, in the Earth’s orbit, and in greenhouse gas levels. They also show that in the past, large changes in climate have happened very quickly, geologically-speaking: in tens of years, not in millions or even thousands." The evidence for abrupt climate change is compelling: More: http://climate.nasa.gov/evidence/ |
|
|
|
|

|
|
|
except of course for the fact that the temperature hasnt actually changed but like .1 degree in fifty years
|
|
|
|
|
|
|
|
|
The earth is now on the brink of entering another Ice Age, according to a large and compelling body of evidence from within the field of climate science. Many sources of data which provide our knowledge base of long-term climate change indicate that the warm, twelve thousand year-long Holocene period will rather soon be coming to an end, and then the earth will return to Ice Age conditions for the next 100,000 years.
Ice cores, ocean sediment cores, the geologic record, and studies of ancient plant and animal populations all demonstrate a regular cyclic pattern of Ice Age glacial maximums which each last about 100,000 years, separated by intervening warm interglacials, each lasting about 12,000 years. During the 1970s the famous American astronomer Carl Sagan and other scientists began promoting the theory that ‘greenhouse gasses’ such as carbon dioxide, or CO2, produced by human industries could lead to catastrophic global warming. Since the 1970s the theory of ‘anthropogenic global warming’ (AGW) has gradually become accepted as fact by most of the academic establishment, and their acceptance of AGW has inspired a global movement to encourage governments to make pivotal changes to prevent the worsening of AGW. The central piece of evidence that is cited in support of the AGW theory is the famous ‘hockey stick’ graph which was presented by Al Gore in his 2006 film “An Inconvenient Truth.” The ‘hockey stick’ graph shows an acute upward spike in global temperatures which began during the 1970s and continued through the winter of 2006/07. However, this warming trend was interrupted when the winter of 2007/8 delivered the deepest snow cover to the Northern Hemisphere since 1966 and the coldest temperatures since 2001. It now appears that the current Northern Hemisphere winter of 2008/09 will probably equal or surpass the winter of 2007/08 for both snow depth and cold temperatures. The main flaw in the AGW theory is that its proponents focus on evidence from only the past one thousand years at most, while ignoring the evidence from the past million years -- evidence which is essential for a true understanding of climatology. The data from paleoclimatology provides us with an alternative and more credible explanation for the recent global temperature spike, based on the natural cycle of Ice Age maximums and interglacials. The reason that global CO2 levels rise and fall in response to the global temperature is because cold water is capable of retaining more CO2 than warm water. That is why carbonated beverages loose [sic] their carbonation, or CO2, when stored in a warm environment. We store our carbonated soft drinks, wine, and beer in a cool place to prevent them from loosing their ‘fizz’, which is a feature of their carbonation, or CO2 content. The earth is currently warming as a result of the natural Ice Age cycle, and as the oceans get warmer, they release increasing amounts of CO2 into the atmosphere. Because the release of CO2 by the warming oceans lags behind the changes in the earth’s temperature, we should expect to see global CO2 levels continue to rise for another eight hundred years after the end of the earth’s current Interglacial warm period. We should already be eight hundred years into the coming Ice Age before global CO2 levels begin to drop in response to the increased chilling of the world’s oceans. The Vostok ice core data graph reveals that global CO2 levels regularly rose and fell in a direct response to the natural cycle of Ice Age minimums and maximums during the past four hundred and twenty thousand years. Within that natural cycle, about every 110,000 years global temperatures, followed by global CO2 levels, have peaked at approximately the same levels which they are at today. The conclusion: The AGW theory is based on data that is drawn from a ridiculously narrow span of time and it demonstrates a wanton disregard for the ‘big picture’ of long-term climate change. The data from paleoclimatology, including ice cores, sea sediments, geology, paleobotany and zoology, indicate that we are on the verge of entering another Ice Age, and the data also shows that severe and lasting climate change can occur within only a few years. While concern over the dubious threat of Anthropogenic Global Warming continues to distract the attention of people throughout the world, the very real threat of the approaching and inevitable Ice Age, which will render large parts of the Northern Hemisphere uninhabitable, is being foolishly ignored. -Pravda |
|
|
|
|
|
|
|
|
except of course for the fact that the temperature hasnt actually changed but like .1 degree in fifty years Well actually in this short time period: 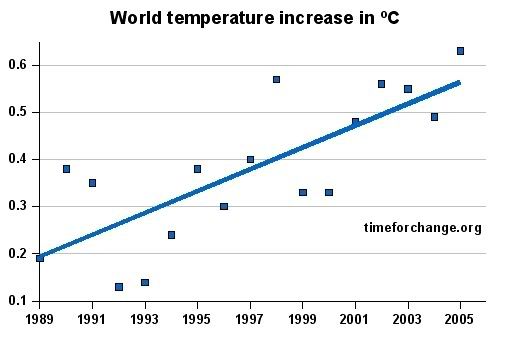 [/url} [/url}
That's enough to cause this: 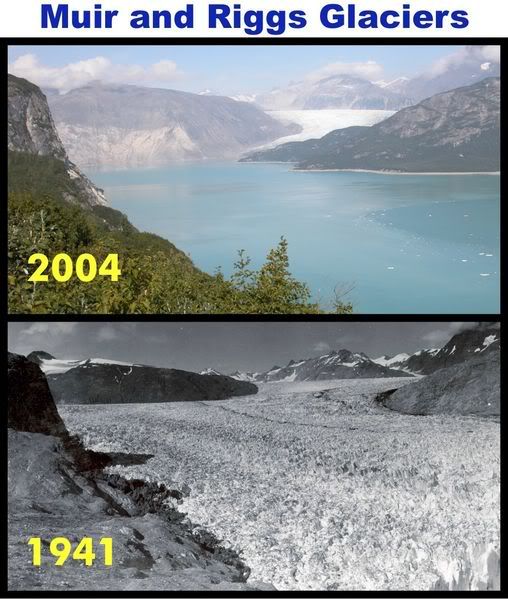
Estimated to be 3 to 5 degrees by 2100 with the shore lines rising 82 feet...making billions homeless. Not to mention the pollution that's ruining our planet. But the debate about climate change has been over for years and the only one's opposing it's acceptance are people with economic interests...or political positioning. |
|
|
|
|
|
|
Edited by
Quietman_2009
on
Sat 02/13/10 09:19 AM
|
|
But the debate about climate change has been over for years and the only one's opposing it's acceptance are people with economic interests...or political positioning. that and scientists with conflicting (non massaged) data 
|
|
|
|
|
|
|
|
|
IPCC officials admit mistake over melting Himalayan glaciers
Senior members of the UN's climate science body admit a claim that Himalayan glaciers could melt away by 2035 was unfounded The Himalayas. The row centres on the IPCC’s 2007 report, which said 'glaciers in the Himalayas are receding faster than in any other part of the world.' The UN's climate science body has admitted that a claim made in its 2007 report - that Himalayan glaciers could melt away by 2035 - was unfounded. The admission today followed a New Scientist article last week that revealed the source of the claim made in the 2007 report by the Intergovernmental Panel on Climate Change (IPCC) was not peer-reviewed scientific literature – but a media interview with a scientist conducted in 1999. Several senior scientists have now said the claim was unrealistic and that the large Himalayan glaciers could not melt in a few decades. In a statement (pdf), the IPCC said the paragraph "refers to poorly substantiated estimates of rate of recession and date for the disappearance of Himalayan glaciers. In drafting the paragraph in question, the clear and well-established standards of evidence, required by the IPCC procedures, were not applied properly." It added: "The IPCC regrets the poor application of well-established IPCC procedures in this instance." But the statement calls for no action beyond stating a need for absolute adherence to IPCC quality control processes. "We reaffirm our strong commitment to ensuring this level of performance," the statement said. -guardian.co.uk |
|
|
|
|
|
|
|
|
it wouldnt surprise me if the planet was warming
but the real unmanipulated data doesnt seem to support it it seems now that every chicken little crying about the earth warming has been cherry picking and manipulating data to support their assertioins maybe the earth is warming but when supposed scientists present false data then the whole thing loses credibility |
|
|
|
|
|
|
Edited by
Quietman_2009
on
Sat 02/13/10 09:29 AM
|
|
the amount of CO2 we put into the atmosphere is pretty trivial: As of 2009, there are only 38 or 39 molecules of CO2 for every 100,000 molecules of atmosphere, and it will take mankind’s CO2 emissions another five years to raise that total by 1 molecule, to 40 out of every 100,000 molecules. The following graph shows how much the CO2 content of the atmosphere has risen in the last 50 years at Mauna Loa, Hawaii. The graph has a vertical scale that only extends to 1% of the atmosphere, and as can be seen, the increase in CO2 is barely visible. This graph is not a trick…it looks different from what you are used to seeing because CO2 is usually plotted with a greatly magnified vertical scale to make the CO2 rise look more dramatic. Yes, we might double the CO2 concentration of the atmosphere by late in this century…but 2 times a very small number is still a very small number.
-Roy Spencer, PhD, Climatologist Earth System Science Center, University of Alabama, Huntsville, Alabama, USA you can make any chart look extreme by magnifying the scale. But if I had done that at any of the jobs I have ever had I would have been fired. The difference between 160 parts per million and 400 parts per million is miniscule atmospheric Co2 content change by percent 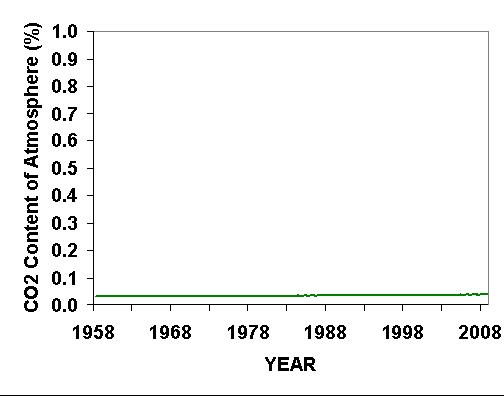
|
|
|
|
|

|
|
|
And yet, the evidence you have shown, Quiet, will be completely dismissed by the AGW hacks.
They, just like the scientists they put their trust in, pick and choose the data they accept. If it doesn't " fit " into their need to control people's lives, it simply doesn't count. There have been thousands of pieces of evidence that refute the AGW theory, but that evidence is simply ignored or minimized as much as possible because it shows that the idea of man being able to control the planet is arrogant and absurd. |
|
|
|
|
|
|
Edited by
Quietman_2009
on
Sat 02/13/10 09:29 AM
|
|
Temperature change of the lower troposphere (LT) in the tropics (20°S–20°N) during the period 1979–2004 is examined using 58 radiosonde (sonde) stations and the microwave-based satellite data sets of the University of Alabama in Huntsville (UAH v5.2) and Remote Sensing Systems (RSS v2.1). At the 29 stations that make both day and night observations, the average nighttime trend (+0.12 K decade−1) is 0.05 K decade−1 more positive than that for the daytime (+0.07 K decade−1) in the unadjusted observations, an unlikely physical possibility indicating adjustments are needed. At the 58 sites the UAH data indicate a trend of +0.08 K decade−1, the RSS data, +0.15. When the largest discontinuities in the sondes are detected and removed through comparison with UAH data, the trend of day and night releases combined becomes +0.09, and using RSS data, +0.12. Relative to several data sets, the RSS data show a warming shift, broadly occurring in 1992, of between +0.07 K and +0.13 K. Because the shift occurs at the time NOAA-12 readings began to be merged into the satellite data stream and large NOAA-11 adjustments were applied, the discrepancy appears to be due to bias adjustment procedures. Several comparisons are consistent with a 26-year trend and error estimate for the UAH LT product for the full tropics of +0.05 ± 0.07, which is very likely less than the tropical surface trend of +0.13 K decade−1.
John R. Christy Earth System Science Center, University of Alabama, Huntsville, Alabama, USA William B. Norris Earth System Science Center, University of Alabama, Huntsville, Alabama, USA Roy W. Spencer Earth System Science Center, University of Alabama, Huntsville, Alabama, USA Justin J. Hnilo Lawrence Livermore National Laboratory, Livermore, California, USA |
|
|
|
|
|
|
Edited by
Quietman_2009
on
Sat 02/13/10 09:41 AM
|
|
something I found interesting is that the atmosphere appears to be self correcting through a negative feedback process
radiative/convective analysis would appear to show that if the CO2 level goes up then the atmospheric humidity adjusts to compensate maintaining the most optimal level for radiative tranfer of atmospheric heat this might be a hard read for some (so they'll prolly just dismiss it) http://www-eaps.mit.edu/faculty/lindzen/adinfriris.pdf |
|
|
|
|
|
|
|
|
Temperature change of the lower troposphere (LT) in the tropics (20°S–20°N) during the period 1979–2004 is examined using 58 radiosonde (sonde) stations and the microwave-based satellite data sets of the University of Alabama in Huntsville (UAH v5.2) and Remote Sensing Systems (RSS v2.1). At the 29 stations that make both day and night observations, the average nighttime trend (+0.12 K decade−1) is 0.05 K decade−1 more positive than that for the daytime (+0.07 K decade−1) in the unadjusted observations, an unlikely physical possibility indicating adjustments are needed. At the 58 sites the UAH data indicate a trend of +0.08 K decade−1, the RSS data, +0.15. When the largest discontinuities in the sondes are detected and removed through comparison with UAH data, the trend of day and night releases combined becomes +0.09, and using RSS data, +0.12. Relative to several data sets, the RSS data show a warming shift, broadly occurring in 1992, of between +0.07 K and +0.13 K. Because the shift occurs at the time NOAA-12 readings began to be merged into the satellite data stream and large NOAA-11 adjustments were applied, the discrepancy appears to be due to bias adjustment procedures. Several comparisons are consistent with a 26-year trend and error estimate for the UAH LT product for the full tropics of +0.05 ± 0.07, which is very likely less than the tropical surface trend of +0.13 K decade−1. John R. Christy Earth System Science Center, University of Alabama, Huntsville, Alabama, USA William B. Norris Earth System Science Center, University of Alabama, Huntsville, Alabama, USA Roy W. Spencer Earth System Science Center, University of Alabama, Huntsville, Alabama, USA Justin J. Hnilo Lawrence Livermore National Laboratory, Livermore, California, USA Dr. John R. Christy, Professor, Atmospheric Science and Director, Earth System Science Center is a speaker for (According to the Center for Science in the Public Interest): "The Marshall Institute which investigates facts concerning global climate change. The Institute also studies the implications of the Kyoto Protocol upon national security. The Institute is partially supported by the Exxon Education Foundation and American Standard Companies." Just like in the HC debate people are listening to industry shills. |
|
|
|
|
|
|
|
|
bah
just another example of how you can manipulate anything to show your preferred result no credibility or science here just copy pasted arguments that some one else is feeding you speaking of shills |
|
|
|
|
|
|
|
|
bah just another example of how you can manipulate anything to show your preferred result no credibility or science here just copy pasted arguments that some one else is feeding you speaking of shills 
EVERYONE involved in the argument has an agenda. Those who have the opposite agenda, disregard the evidence proposed by the other side. No matter HOW accurate the evidence is. |
|
|
|
|

|
|
|
bah just another example of how you can manipulate anything to show your preferred result no credibility or science here just copy pasted arguments that some one else is feeding you speaking of shills absolutely...100% correct !...
|
|
|
|
|

|
|
|
except of course for the fact that the temperature hasnt actually changed but like .1 degree in fifty years The above statement is 100% false. The graph you posted pertains to the temperature of the lower atmosphere only while much of the earth's solar heat sink is in the oceans, surface soils, upper atmosphere, and ice caps. You refer to "cherry picking data" and then proceed to do exactly that. The percentage of CO2 in the atmosphere does not matter in it's percentage by weight, volume, or any other factor other than it reflectivity to infrared radiation. This is what causes greenhouse gas effects. You should know this. The greenhouse effect of the increase in CO2 levels is well documented. |
|
|
|
|
|
|
|
|
all the stuff I've read says that CO2 follows temperature not causes temperature. and that there is about a 800 year lag time in that
like I say I expect the temperature prolly is rising but for every piece of work to support it there is a data to refute it too |
|
|
|
|
|
|
|
|
The above statement is 100% false.
I'm looking for the article apparently all the temperature measurments over the last 50 years were (again) massaged to show a misleading result. and that the raw data indicates very little if any warming trend I'll try to find it |
|
|
|
|
|
|
Edited by
Quietman_2009
on
Sat 02/13/10 10:34 AM
|
|
something intersting
I wouldnt draw any conclusions you could hang your hat on but still... 
ignore that long red line at the end, that's just an extrapolation which like most extrapolations is prolly wrong 

|
|
|
|
|
|
|
|
|
The above statement is 100% false.
I'm looking for the article apparently all the temperature measurments over the last 50 years were (again) massaged to show a misleading result. and that the raw data indicates very little if any warming trend I'll try to find it oh it's .1 Kelvin now I have to find a conversion |
|
|
|
|


